Value Stocks Are Making Up Ground on Growth Stocks…Or Are They?
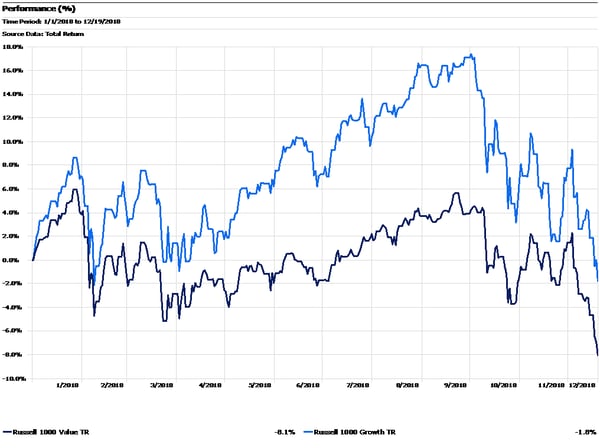
At the end of the third quarter, large cap growth stocks (Russell 1000 Growth Index) were outperforming their value counterparts (Russell 1000 Value Index) by over 10%. Since then, value stocks have made a comeback on a relative basis as shown by the graph below.
Russell 1000 Value Index versus Russell 1000 Growth Index,
Year-to-Date 2018 Performance

Source: Morningstar Direct
Many investors predicted this type of mean reversion, especially since value stocks own the superior track record over long (multi-market cycle) time periods. Furthermore, many growth stocks had been trading at very high multiples throughout much of the year, so it was expected that they had more room to fall when the market inevitably cooled off. While this scenario has played out accordingly, there is more to the story than just growth versus value, particularly when it comes to sectors.
Technology stocks account for approximately 30% of the Russell 1000 Growth Index, although this weighting is constantly shifting due to market fluctuations. With such a large weighting, the performance of the technology sector plays a large part in the direction of the overall index. On the value side of the spectrum, technology accounts for under 10% of the Russell 1000 Value Index. We have written in the past about the low market breadth and the small number of stocks (mostly technology companies) moving the overall market higher throughout 2018. This effect was especially pronounced in growth-oriented indices given these higher technology weightings.
Read more: Mutual Funds' Pro-Growth Sector Bets Could Be a Timebomb
With this knowledge, the conversation advisors should be having is around sector performance rather than comparing broad factors like growth versus value. Expensive, fast-growing technology names like the FAANGs1 propelled the market higher through the first three quarters, but these stocks combined lost over $1 trillion in market cap within the first month of the selloff (quite a different narrative than the “race to the first $1 trillion market cap company” we experienced in early August.) These days, it’s not uncommon to see a FAANG stock down 3% or more when the broad market (the S&P 500 Index for example) is only down around 1%. This is yet another example of the double-edged aspect of high-flying technology stocks: their downside volatility is usually very similar to their upside volatility.
1FAANG is an acronym for the market's five most popular and best-performing tech stocks, namely Facebook, Apple, Amazon, Netflix and Alphabet’s Google.
Dana Large Cap Equity Fund top-ten holdings as of September 30, 2018: Apple Inc. (2.48%), Pfizer Inc. (2.36%), Amgen Inc. (2.21%), WellCare Health Plans, Inc. (2.18%), UnitedHealth Group Inc. (2.15%), Stryker Corporation (2.12%), Alphabet Inc. Class A (2.10%), Microsoft Corporation (2.10%), Bristol-Myers Squibb (2.05%), Johnson & Johnson (2.03%).
Dana Small Cap Equity Fund top-ten holdings as of September 30, 2018: Universal Insurance Holdings, Inc. (2.34%), Bottomline Technologies, Inc. (2.14%), Ligand Pharmaceuticals, Inc. (2.05%), Marcus Corporation (2.03%), Emergent BioSolutions Inc. (2.00%), Primerica, Inc. (1.99%), Boot Barn Holdings, Inc. (1.98%), BioTelemetry Inc. (1.87%), Chefs' Warehouse, Inc (1.83%), Comfort Systems USA, Inc. (1.83%).


