
In the U.S., mutual funds have been around, in one shape or another, since the early 20th century. However, it wasn’t until the bull markets of the 1980s and 1990s when this investment vehicle became more of a household name for retail investors. The diversified nature of these funds was a major selling point compared to owning a handful of individual stocks and/or bonds. After the bursting of the tech bubble in the early 2000s, asset flows slowly started shifting from mutual funds toward passive index products like ETFs, and this trend was clearly exacerbated after the Global Financial Crisis in 2008, as shown by the graph below.
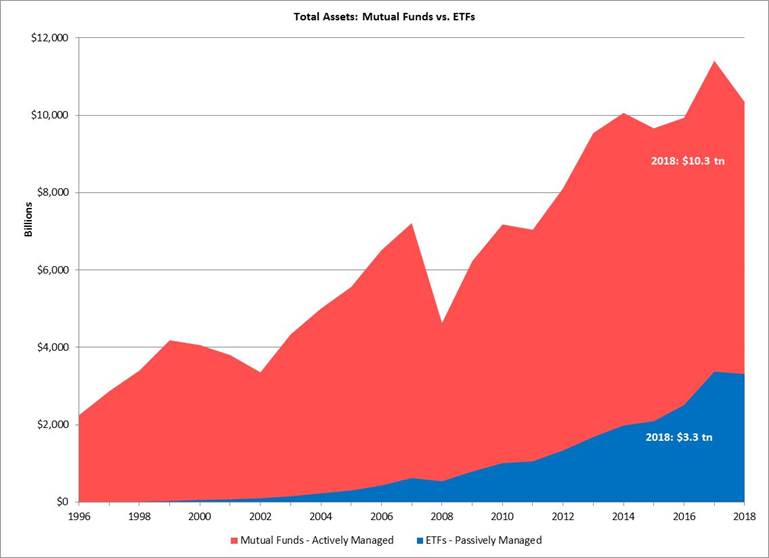 Image source: Morningstar, Inc.
The rise in passively-managed assets is important in terms of stock pricing and correlations. Waves of passive flows affect entire baskets of stocks, including specific categories like individual sectors or factors. Utility stocks are a good example. Often electric-energy providers, these stocks provide a very specific factor (high-dividend yield) which tends to be in favor in periods of market distress. When investors pile into high-dividend ETFs, these assets are blindly divvied-up amongst the index constituents (many of which in this example are electric utility companies) completely regardless of company valuations or fundamentals.
Within small-cap stocks, the discrepancy in company quality is startling. Roughly a third of the 2,000 companies in the Russell 2000 Index do not have positive earnings (as of 9/30/2018). Would you feel comfortable facing a potential recession with 33% of your small cap exposure in non-earners? Probably not, but many passive investors don’t realize this.
When a large passive wave hits or leaves the Index, high-earning companies and non-earners tend to move together. The phrase “throwing the baby out with the bathwater” is often used to paint this picture. What does this mean for active managers? Stocks that are mispriced because of excessive passive flows can present investment opportunities, but there needs to be a decrease in correlations and an increased emphasis on company fundamentals for these opportunities to pay off. When does this typically occur? Not during periods of heightened volatility, which is what we’re experiencing now.
VIX Volatility Index, Trailing 6mo.
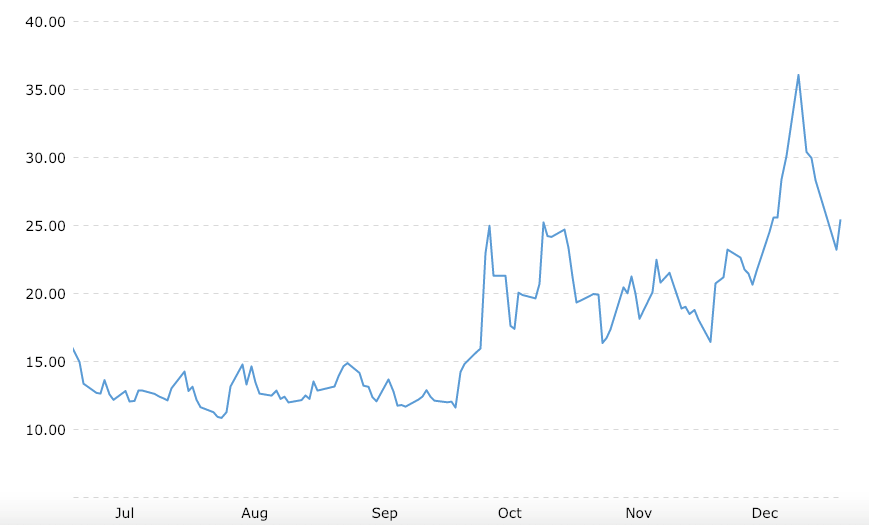
Image source: https://www.macrotrends.net/2603/vix-volatility-index-historical-chart
Stocks tend to become more correlated in times of market stress. But by taking advantage of market volatility and establishing/increasing positions in underpriced, high-quality companies, active managers can position themselves to benefit when markets stabilize and correlations inevitably normalize.

Dana Large Cap Equity Fund top-ten holdings as of December 31, 2018: Pfizer Inc. (2.07%), Microsoft Corporation (2.06%), Amgen Inc. (2.05%), T-Mobile Inc. (2.03%), Alphabet Inc. Class A (2.03%), Kimberly-Clark Corp (2.02%), UnitedHealth Group Inc. (2.01%), Apple Inc. (2.01%), Comcast Corp (A) (2.00%), Intel Corp (1.99%).
Dana Small Cap Equity Fund top-ten holdings as of December 31, 2018: Chesapeake Utilities Corp. (2.00%), Marriott Vacations Worldwide Corporation (1.96%), Southwest Gas Corp (1.96%), Primerica Inc. (1.92%), Cadence Bancorporation Class A (1.84%), Western Alliance Bancorporation (1.80%), STAG Industrial Inc. (1.80%), First Bancorp (1.79%), Ruth's Hospitality Group Inc. (1.79%), Preferred Apartment Communities (1.78%).