How Heightened Cash Levels Could Prolong the Equities Bull Market
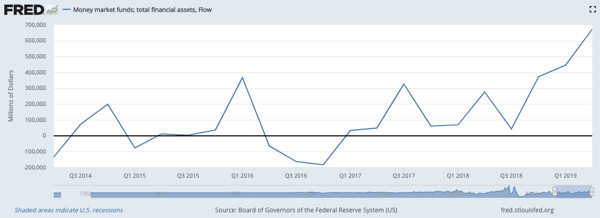
Asset flows into money market funds have accelerated considerably since the selloff in late 2018, as illustrated by the graph below. According to the Investment Company Institute, more commonly known as ICI, total money market assets (including institutional and retail funds) currently stand at $3.4 trillion as of 9/18/19, which is the most recent available date.1
Money Market Flows, Trailing Five Year Period
As of 9/24/19
Source: Federal Reserve Bank of St. Louis
During the depths of the Global Financial Crisis, money market flows assets topped-out at around $3.9 trillion2. So today’s levels are approaching these all-time highs.
So why is this important? With the Fed lowering interest rates, the yield on money market funds is on the decline, and investors may begin returning to stocks for their relatively higher yield. The S&P 500 Index currently yields approximately 1.9%3 compared to about 1.8% for the 1-year Treasury bond4. Shorter-dated Treasury yields will continue to decline assuming the Fed continues to lower its benchmark rate.
Back in July, we authored a blog titled Net Outflows and the Unloved Bull Market which detailed how the U.S. equity market has continued to rise despite investors pulling more than $400 billion over the past ten years. If even a fraction of the $3.4 billion in money market assets returns to stocks, it could provide a meaningful tailwind that could further support the longest bull market in history.
If you would like to be notified when we release new market insights, please fill out the form on the
right, "Stay up to date with current market trends," and we will send you an email.

1 https://www.ici.org/research/stats/mmf
2 https://www.cnbc.com/2019/09/24/this-could-be-dry-powder-for-the-markets-money-manager-says.html
3 https://www.multpl.com/s-p-500-dividend-yield
The links above open new windows that are not part of www.danafunds.com.


