Top-Heavy & Troubling: S&P 500 Bears Extreme Concentration Risk
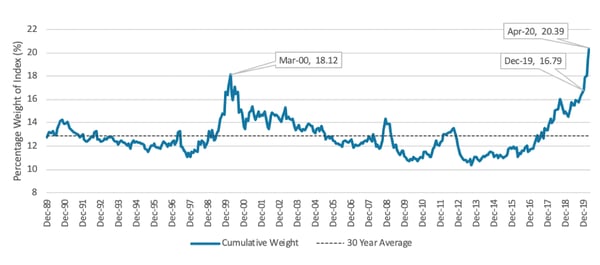
The S&P 500 bears an extreme risk: too few stocks account for too much of its weight. The index is experiencing extreme concentration risk not seen in the last 30 years, with its five largest stocks now accounting for more than 20% of the entire index.
The chart below shows just how out of balance the weightings of the largest S&P 500 stocks have become. Currently, the total index weight of the five largest holdings is more than five standard deviations1 above normal.
S&P 500 Index’s Top 5 Largest Holdings – 4/30/20 Sources: FactSet Data Systems, Dana Investment Advisors
The performance of the index’s five largest stocks has dwarfed the performance of the broader index, with the top five holdings returning 25.6% annualized over the past five years,* compared to just 6.5% for the other 495 stocks. That outperformance has given these stocks excessive weights in the S&P 500 and carries risk for index investors over the long term.
What Could Go Wrong?
Historically, extreme levels of market concentration have not been sustainable and were followed by sharp corrections – and the relative weighting of the five largest companies returning to more normalized levels.
While we won’t try to predict the direction of the market from here, we do see risks in holding a top-heavy index, or being over weighted to these stocks.
Many of the top five holdings in the S&P 500, and other common U.S. equity indices, sit within the “FAANG** + Microsoft” basket of stocks. The momentum that drove these stocks’ outperformance and pushed up their index weights has also led to high valuations.
For comparison, the FAANG + Microsoft basket of stocks has an average P/E ratio2 of 50.4, compared to 15.5 for the rest of the index. Another way to look at the bloat atop the index is the revenue-to-weight ratio: FAANG+Microsoft produced only 4% of the trailing 12-month revenue for the S&P 500, but represents over 21% of the index by weight.
If one of these companies hits any type of snag in its growth trajectory – whether it be simply hitting the ceiling of its addressable market or an executional misstep – the market is likely to punish the stock more harshly because of its high valuation. Due to the stock’s position size, it could have a larger-than-normal effect on index performance.
How Are We Mitigating Concentration Risk?
At Dana, we like the business models and growth potential of some – but not all – of the larger stocks in the index and hold some of those stocks in our portfolios. But we don’t want a select few stocks to have an outsized effect on portfolio performance, so we manage and limit our individual position sizes appropriately. We believe those limits protect our investors from the outsized risk that indices such as the S&P 500 currently bear.
1Standard deviation measures the dispersion of a set of values. A low standard deviation indicates values are typically close to the mean of the set. A high standard deviation means the values are spread over a wider range.
2The P/E ratio, or price-earnings ratio, is a common metric for valuing companies, and is a ratio of the company’s share price to its earnings per share.
*As of 4/30/2020.
**The FAANG basket of stocks includes Facebook, Amazon, Apple, Netflix and Google, five stocks who have received a lot of attention for driving equity market performance in recent years. Microsoft was later added to that basket in many comparisons.
Dana Large Cap Equity Fund top-ten holdings as of March 31, 2020: Microsoft Corp (2.70%), Apple, Inc. (2.66%), Intel Corp (2.43%), Amazon.com, Inc. (2.34%), Alphabet Inc. Class A (2.32%), LAM Research Corp. (2.28%), Walmart, Inc. (2.27%), Merck & Co, Inc. (2.20%), T-Mobile, Inc. (2.15%), Visa, Inc. (2.15%)
Dana Small Cap Equity Fund top-ten holdings as of March 31, 2020: Five9, Inc. (2.52%), Southwest Gas Corp (2.43%), Horizon Therapeutics (2.25%), Emergent BioSolutions, Inc. (2.24%), Qualys, Inc. (2.22%), Coherus BioSciences, Inc. (2.19%), Rapid7, Inc. (2.17%), BioTelemetry, Inc. (2.13%), Repligen Corp (2.12%), Chesapeake Utilities Corp (2.10%)
Dana Epiphany ESG Equity Fund top-ten holdings as of March 31, 2020: Microsoft Corp (2.72%), Apple, Inc. (2.68%), Alphabet, Inc. Class C (2.67%), Amazon.Com, Inc. (2.43%), Intel Corp (2.23%), General Mills, Inc (2.22%) LAM Research Corp (2.16%), Hill-Rom Holdings, Inc. (2.12), Fidelity National Information Services, Inc. (2.10%), Pepsico, Inc. (2.07%)
To view the standardized performance for the Dana Large Cap Equity Fund, click here.
To view the standardized performance for the Dana Small Cap Equity Fund, click here.
To view the standardized performance for the Dana Epiphany ESG Equity Fund, click here.


